Pontifications
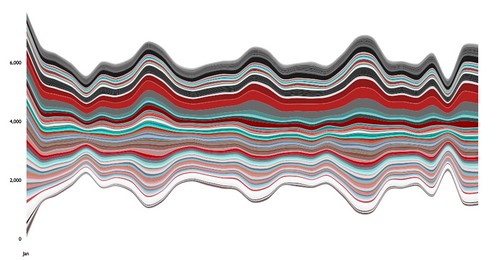
- To answer Jens’s twitter question, the colours correspond to the average colour of each instagram photo. Each average colour is one of 657 plotrix colours and the y axis shows both the colour as the actual colour and a count for January 1,2,3,…31, 2016.
Streamgraph of 600 int colours of string Colourname : average colour instagram vancouver january 2016 aes-x-hour-y-colourname* Invoked as:
cd /Users/rtanglao/Dropbox/GIT/2016-r-rtgram/JANUARY2016
Rscript ../default-small-size-art-of-where-leggings-streamgraph-600colourint-igvan-jan2016-avgcolour.R
From https://github.com/rtanglao/2016-r-rtgram/blob/master/default-small-size-art-of-where-leggings-streamgraph-600colourint-igvan-jan2016-avgcolour.R
library(tidyverse)
library(plotrix)
library(ggjoy)
library(R.utils)
library(anytime)
library(streamgraph)
library(htmltools)
library(exportwidget)
library(htmlwidgets)
library(webshot)
library(knitr)

args <- commandArgs(asValue=TRUE)

getnumericColour <-
  function(colorname) {
    colour_matrix=col2rgb(colorname)
    return(as.numeric(colour_matrix[1,1]) * 65536 +
             as.numeric(colour_matrix[2,1]) * 256 +
             as.numeric(colour_matrix[3,1]))
  }
main <- function() {

  csv_url <-
    "https://raw.githubusercontent.com/rtanglao/2016-r-rtgram/master/JANUARY2016/january2016-ig-van-avgcolour-id-mf-month-day-daynum-unixtime-hour-colourname.csv"

  average_colour_ig_van_jan2016 <-
    read_csv(csv_url)

groupedby_date_sixhundred_colourint <- average_colour_ig_van_jan2016 %>%
  rowwise() %>%
  mutate(date = anydate(unixtime)) %>%
  group_by(date, colourname) %>%
  tally() %>%
  rowwise() %>%
  mutate(sixhundred_colourint = getnumericColour(colourname))

colour_hex_strings_all <-
  sapply(groupedby_date_sixhundred_colourint$sixhundred_colourint,
         function(x){
           sprintf("#%6.6X", x)})
colour_named_vector <-
  setNames(as.character(colour_hex_strings_all),
           colour_hex_strings_all)

# from http://www.buildingwidgets.com/blog/2015/4/9/week-14-exporting-widget

html_print(
    streamgraph( groupedby_date_sixhundred_colourint,
                "sixhundred_colourint", "n", "date",
                interactive=FALSE) %>%
    sg_fill_manual(values=colour_named_vector),
    viewer = NULL) %>%
    normalizePath(.,winslash="/") %>%
    gsub(x=.,pattern = ":/",replacement="://") %>%
    paste0("file:///",.) %>%
    webshot(
        file = "default-small-size-artofwhere-headless-streamgraph.png", delay = 10,
        selector = ".streamgraph",
        )
}
sink("log.txt")

main()

sink()
Output
Leave a comment on github